Algorithmic bias isn't just a social issue—it's a mathematical one. If one variable ranges from 0 to 1 and another from 0 to 1,000,000, many models will be "blinded" by the larger number, ignoring the subtler, arguably more important patterns in the smaller one.
Data Transformation is the art of democratizing your features, ensuring that every variable gets a fair vote in the final prediction. Let's explore the essential techniques to level the playing field.
1. The Challenge of Scale
Distance-based algorithms (like KNN, K-Means, and SVM) and gradient-based algorithms (like Neural Networks) are highly sensitive to the scale of input data.
Magnitude Matters
Imagine predicting house prices using Number of Rooms (1-5) and Square Footage (500-5000).
Without scaling, a change of 1 room is mathematically overwhelmed by a change of 100 sq ft, even though an extra room might be more valuable. The model sees the "distance" of 1 as negligible compared to 100.
2. Core Transformation Techniques
There is no "one size fits all" scaler. The choice depends on your data's distribution and the model you intend to use.
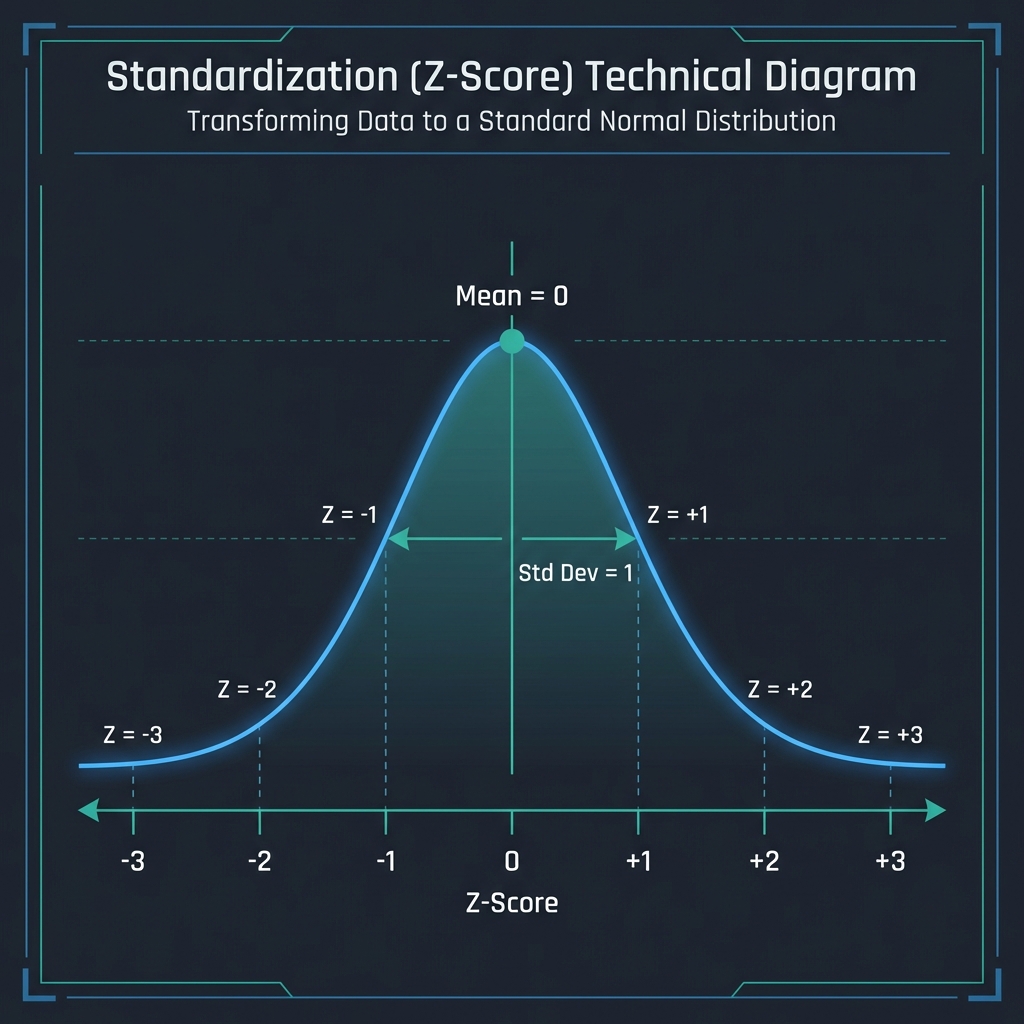
Standardization (Z-Score)
Rescales data to have a mean (μ) of 0 and standard deviation (σ) of 1.
- Formula:
z = (x - μ) / σ - Best For: Algorithms that assume a Gaussian distribution (Linear Regression, Logistic Regression) and Support Vector Machines.
- Pro: Handles outliers better than Min-Max.
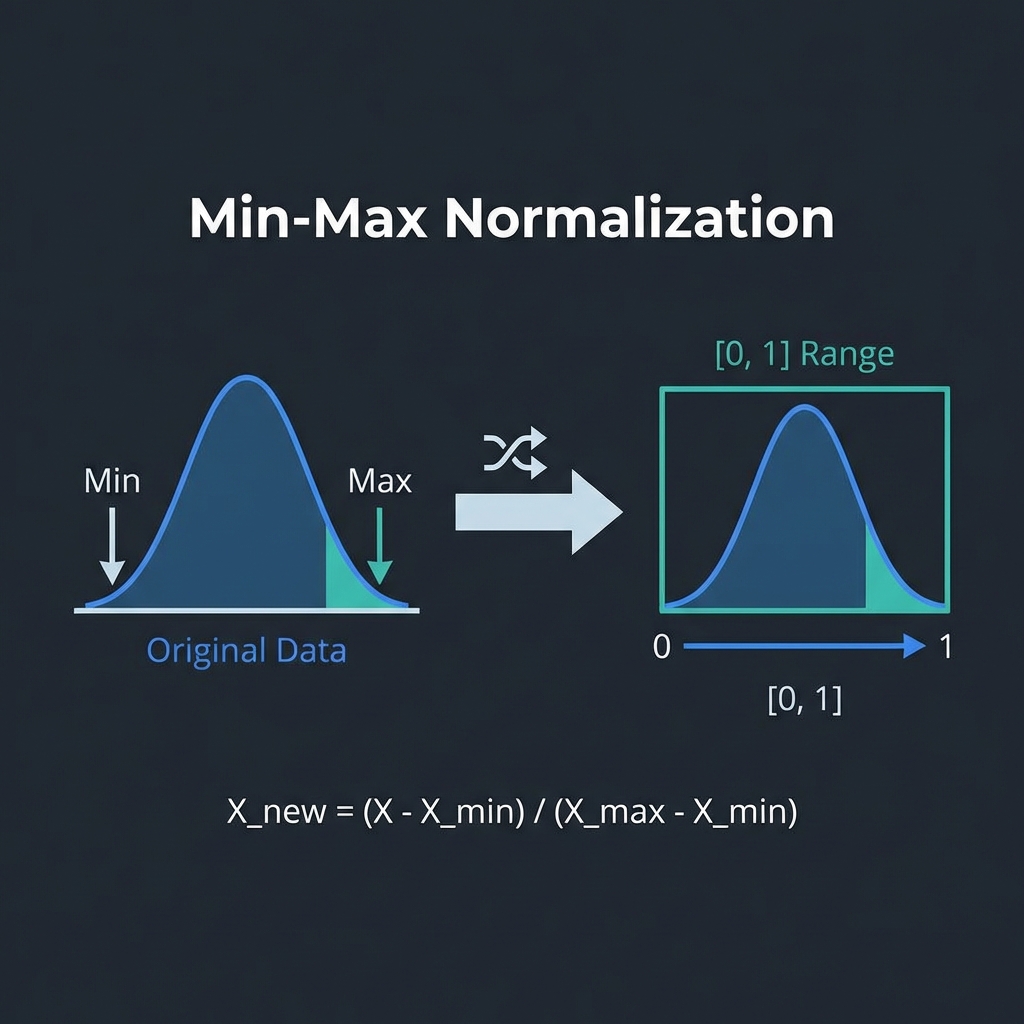
Min-Max Scaling (Normalization)
Compresses all values to a fixed range, usually [0, 1].
- Formula:
x_scaled = (x - min) / (max - min) - Best For: Neural Networks (Deep Learning) and algorithms that do not make assumptions about the distribution of data (KNN).
- Con: Very sensitive to outliers. A single massive value can squash all other data into a tiny range.
Log Transformation
Applies a natural logarithm to the data.
- Best For: Highly skewed data (long tails), such as income distribution or population segments. It compresses large values and spreads out small values, making the distribution more "normal".
3. Streamlined Workflow in AIMU
Manually coding these pipelines for dozens of columns is prone to error. AIMU creates a visual interface to apply these powerful transformations instantly.
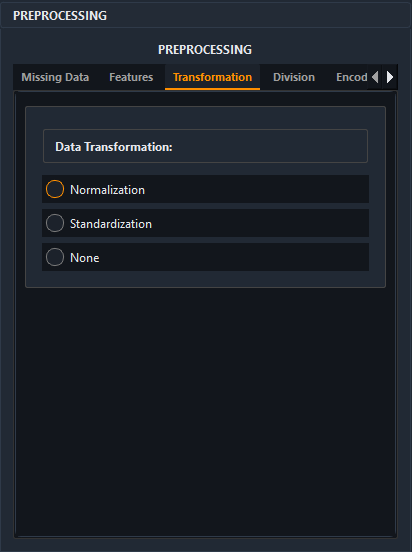
With AIMU's Preprocessing Engine, you can:
- Auto-Detect Needs: The system highlights columns with significant scale disparities.
- Select per Column: Apply
StandardScalerto your gaussian features andLogTransformto your twisted income data independently. - Visualize Impact: Instantly see the histogram change before committing the transformation.
Tree-based models (like Decision Trees, Random Forests, and XGBoost) are generally invariant to feature scaling. They split data based on thresholds, so the absolute value doesn't matter as much. However, scaling rarely hurts and maintains consistency if you switch models later!
Conclusion
Data transformation is the unsung hero of model accuracy. By ensuring your features speak the same language effectively, you prevent your model from being biased by arbitrary units of measurement. Whether you are building a simple regression or a complex neural network, proper scaling is the foundation of robust performance.
Optimize Your Pipeline
Experience the difference clean data makes. Download AIMU today and explore our advanced preprocessing suite.